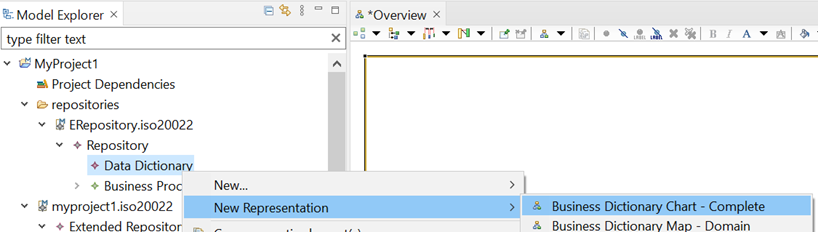
3 Chart the ERepository
Create a chart of the ERepository business components
![](https://iso20022.plus/wp-content/uploads/2022/10/image-15.png)
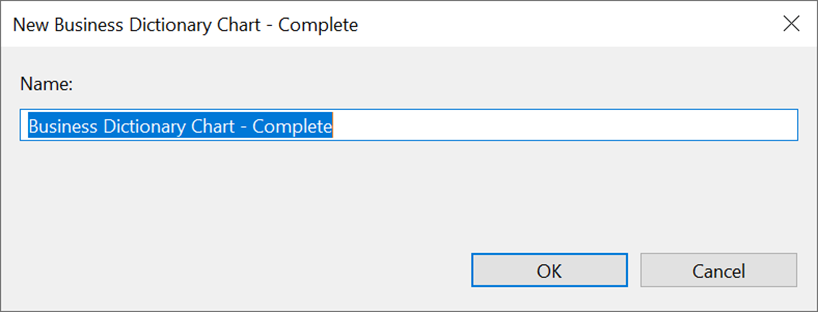
You have to option to name it.
![](https://iso20022.plus/wp-content/uploads/2022/10/image-16.png)
It’s a big chart, so may take some time on older computer.
![](https://iso20022.plus/wp-content/uploads/2022/10/image-17.png)
Use [Ctrl+o] to list and filter items on the diagram.
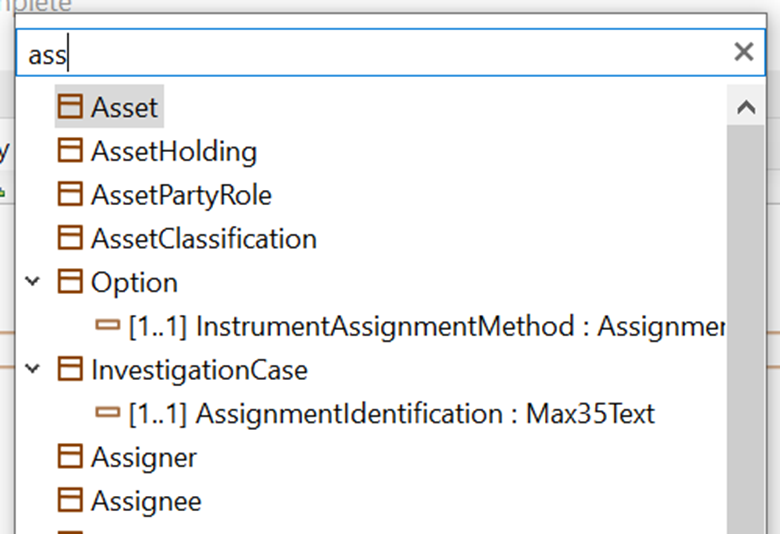
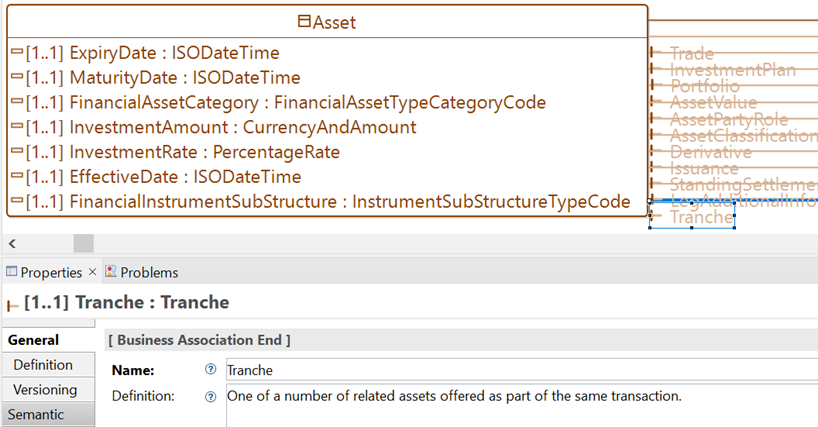
![](https://iso20022.plus/wp-content/uploads/2022/10/image-18.png)
Select Asset
![](https://iso20022.plus/wp-content/uploads/2022/10/image-19.png)
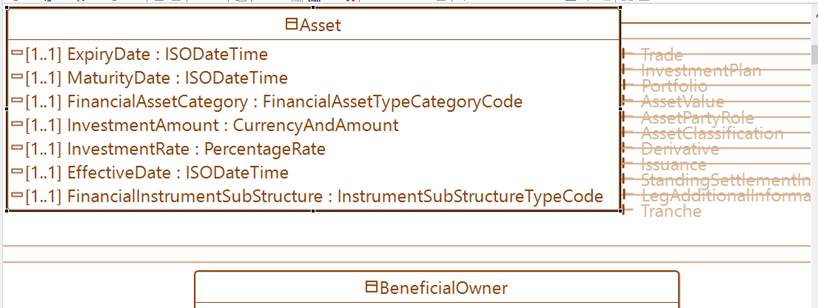
Select an attribute or association to see its definition in the properties tab.
![](https://iso20022.plus/wp-content/uploads/2022/10/image-21.png)